The numbers are not subtle. A detailed analysis of every power plant that came online in the United States this year reveals that solar is not merely leading the energy transition — it is lapping the competition by a margin that would have seemed implausible a decade ago. Ars Technica’s report, titled So much solar, digs through federal commissioning data to map exactly what the US electricity grid added in 2026 and what it reveals about where power generation is heading. For anyone tracking the clean energy rivalry between global powers, the data lands with real force.
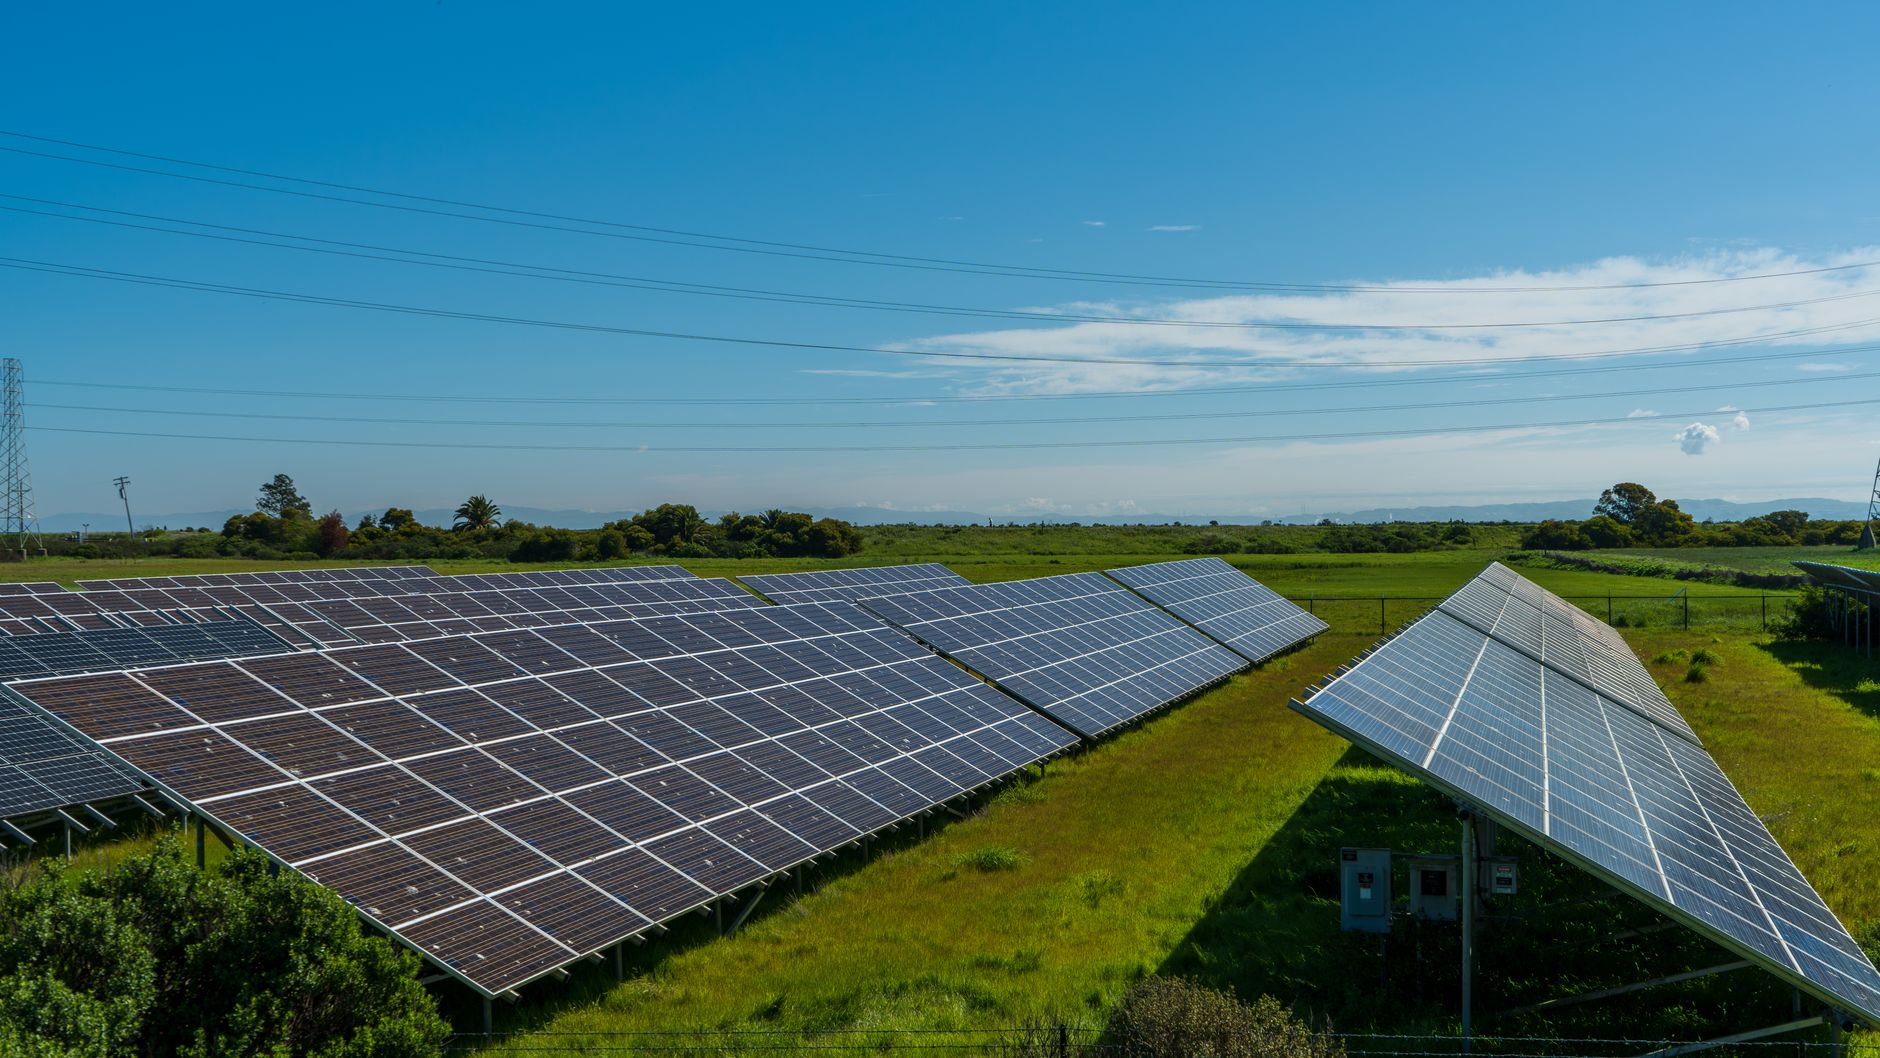
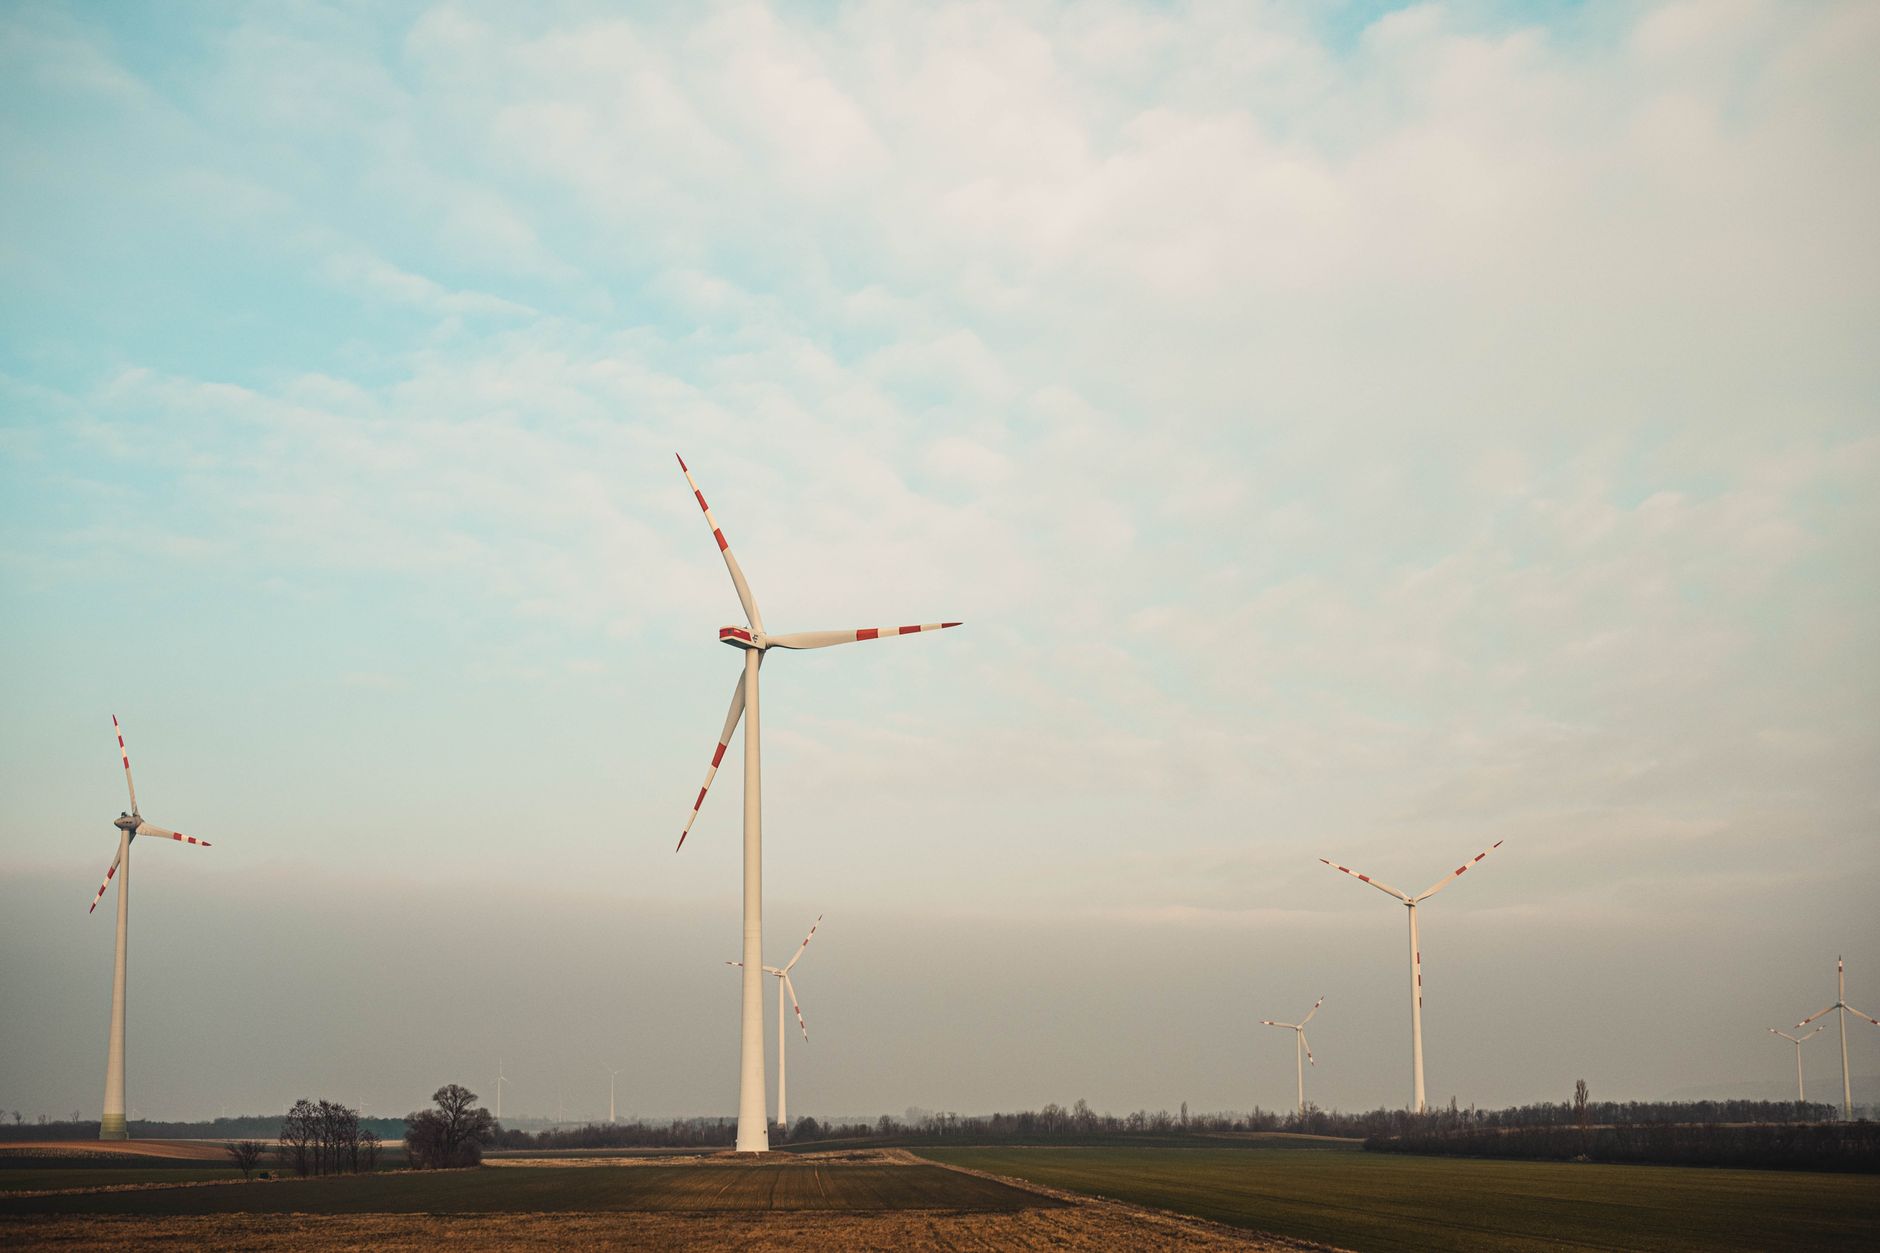
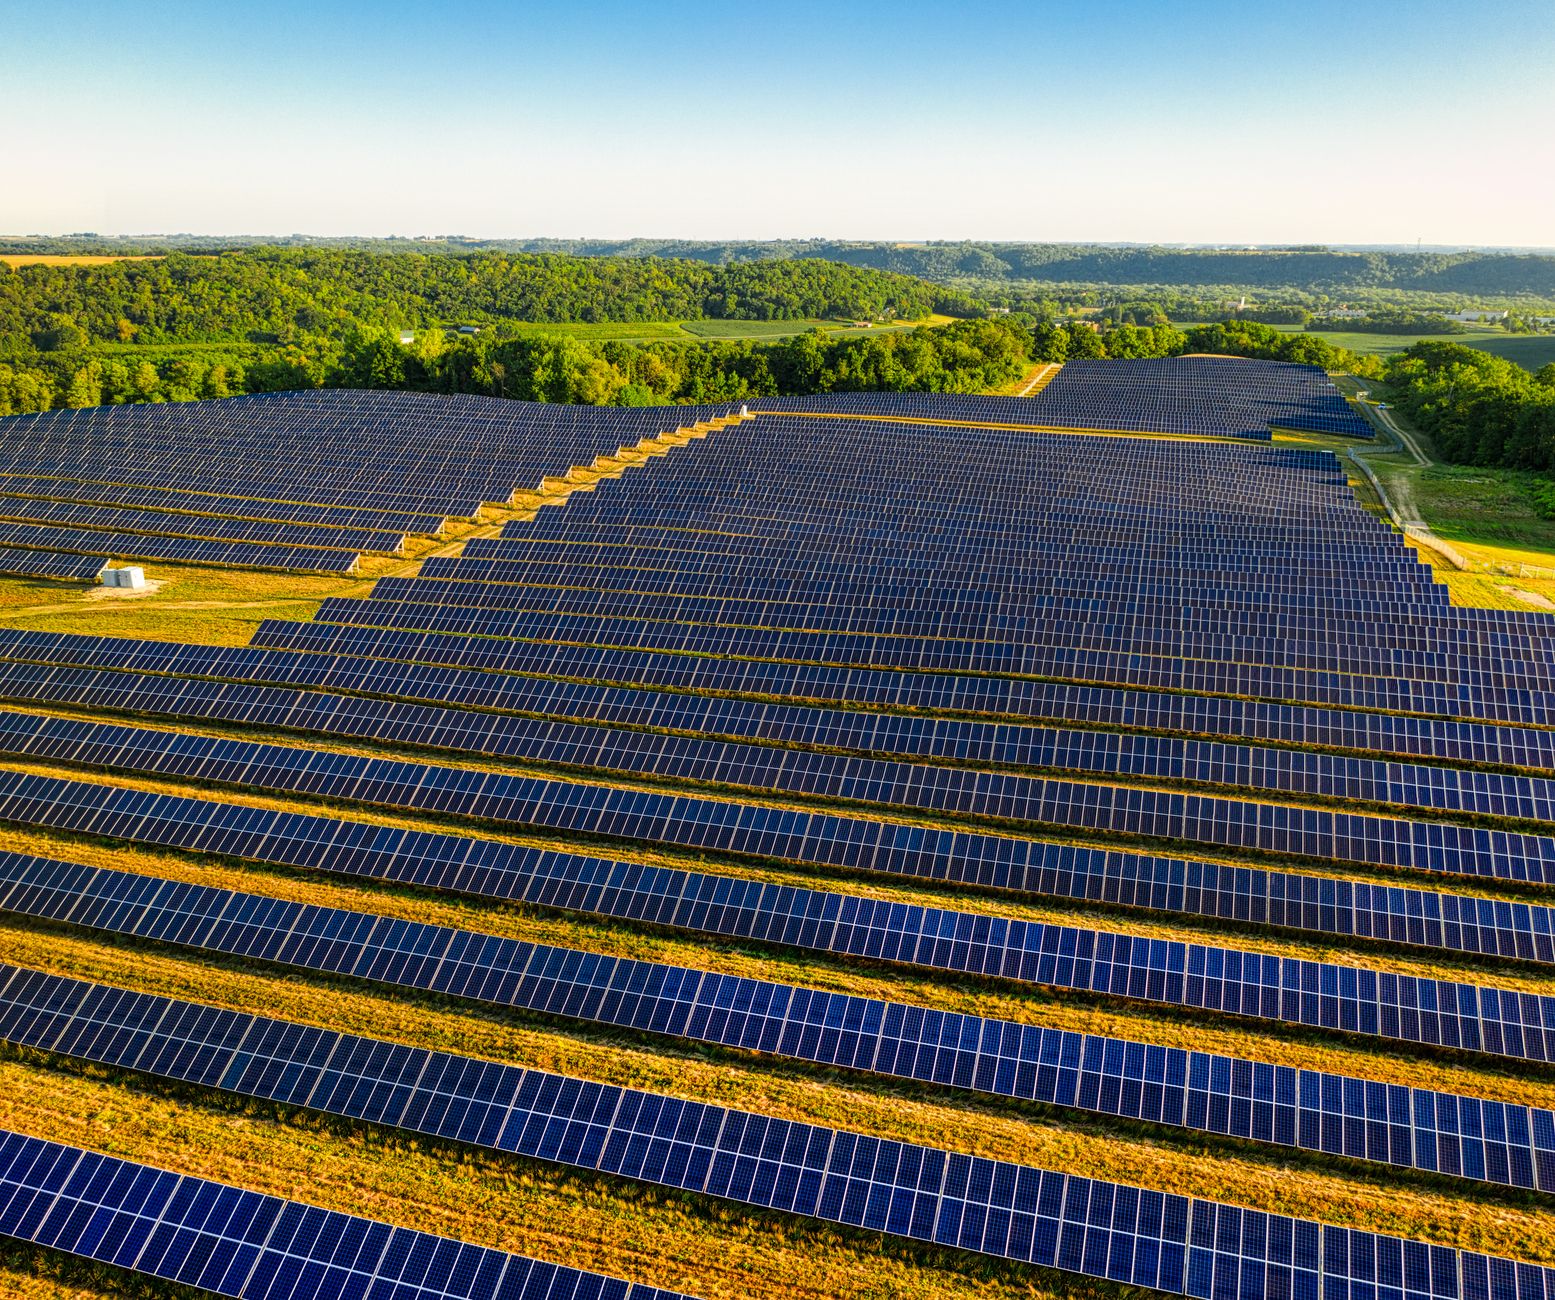
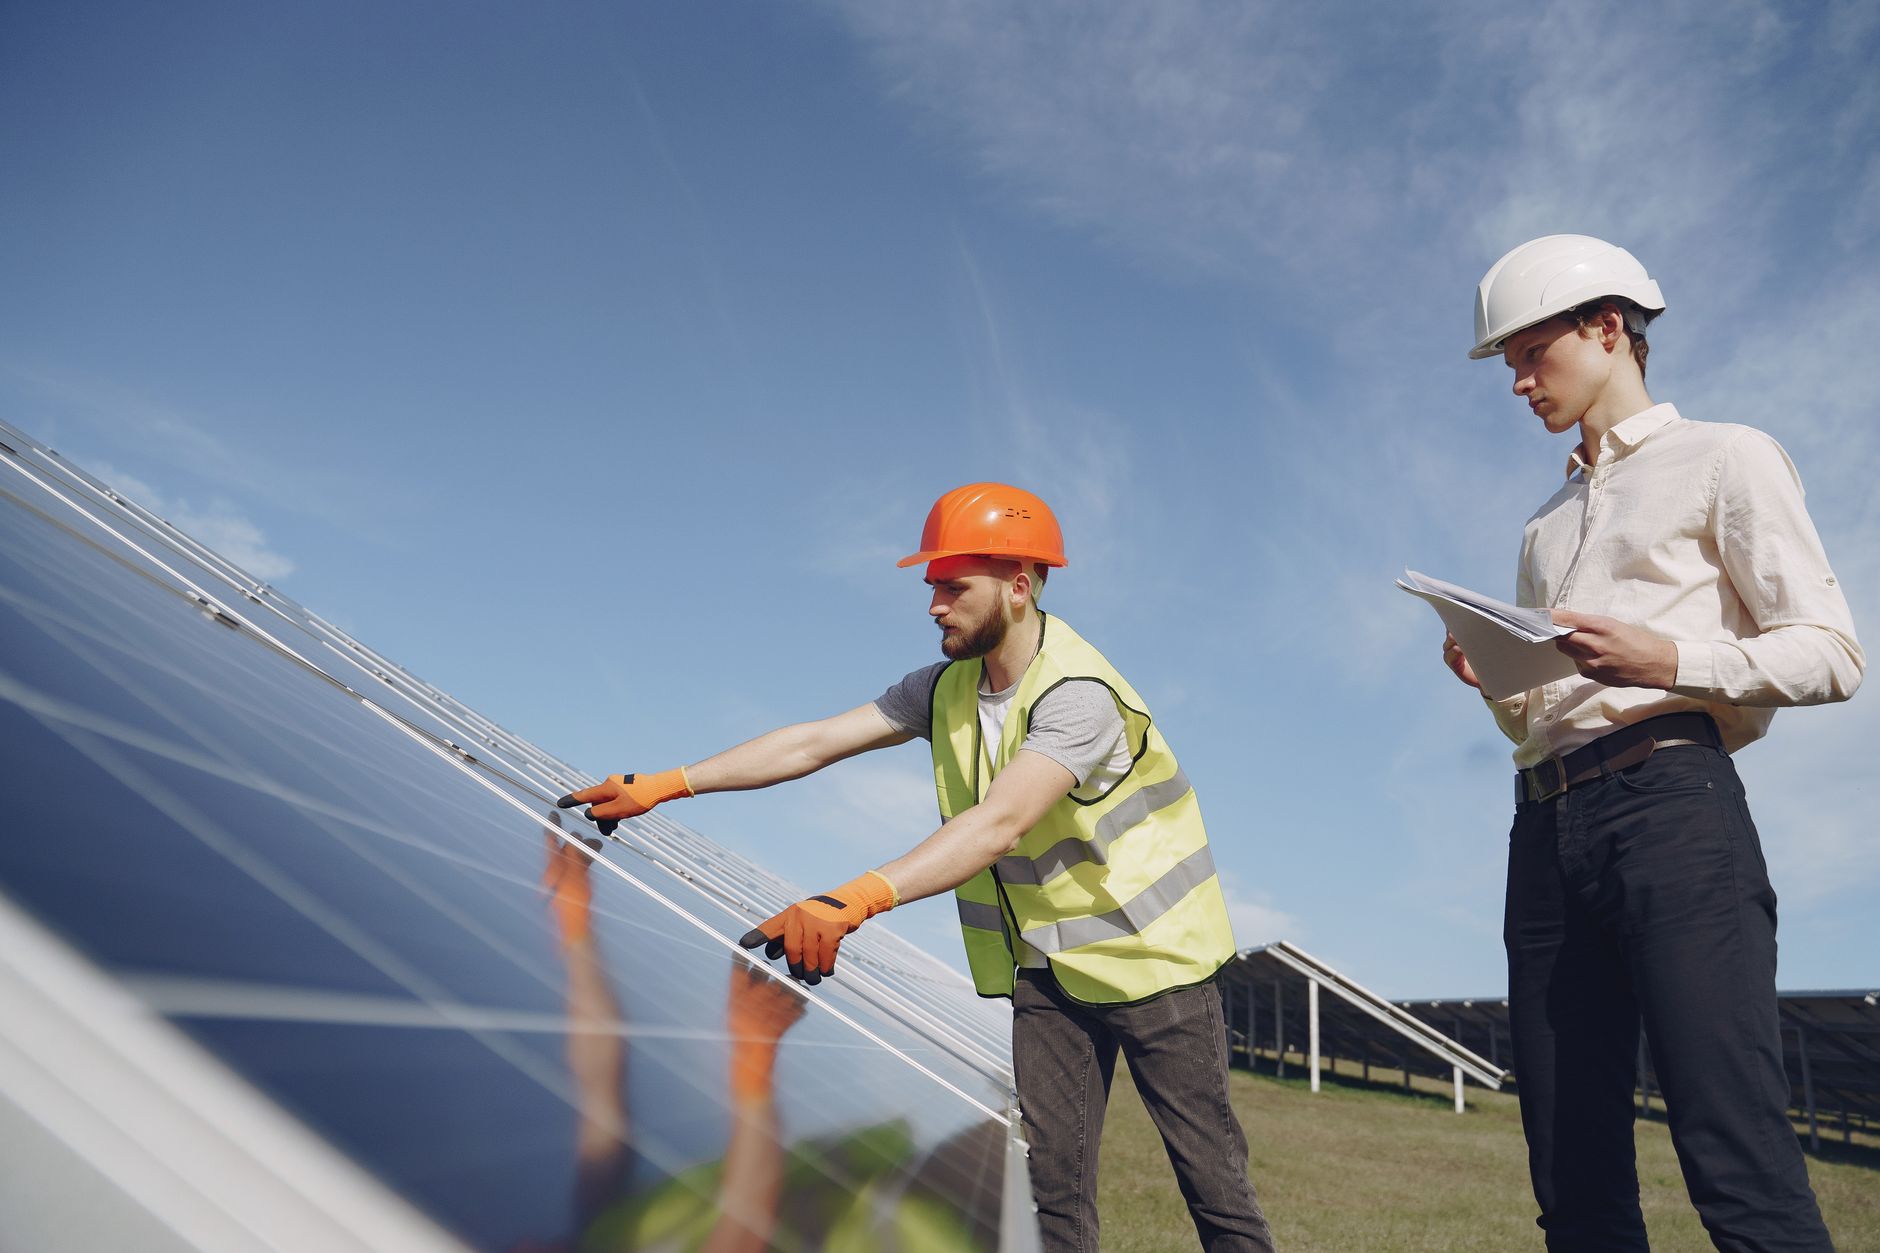
Solar accounted for the overwhelming majority of new generating capacity commissioned across the country this year. The scale is staggering: gigawatt-scale solar farms are now routine additions to the grid, and the pace of commissioning has accelerated compared to prior years. Battery storage paired with solar projects has also expanded sharply, with co-located storage becoming a standard feature of new utility-scale installations rather than an optional add-on. Wind added meaningful capacity as well, but its share of new builds was dwarfed by photovoltaic installations across the Sun Belt, the Midwest, and increasingly the Southeast.
What the Commission Data Actually Shows
The raw commissioning records, drawn from Energy Information Administration filings, reveal a grid transformation happening faster than most policy timelines anticipated. Natural gas, once the reliable swing capacity that developers turned to when demand grew, barely registered in new plant additions this year. The few gas projects that did come online were largely peaker plants in markets where grid operators still require dispatchable backup — a need that battery storage is steadily absorbing. Coal, predictably, added nothing new.
The geographic spread of new solar is worth noting. While Texas and California remain dominant markets by total megawatts, states not typically associated with solar leadership — including Georgia, North Carolina, and parts of the Midwest — contributed meaningfully to the year’s totals. That diversification matters because it signals solar is no longer dependent on a handful of regional policies or especially generous irradiance conditions. Falling panel costs and transmission improvements have widened the viable footprint considerably. The same cost deflation that has driven this buildout is also reshaping competitive dynamics in global battery supply chains, a tension covered in detail in Future Wire’s reporting on market dynamics earlier this year.
Why This Pace Changes the Grid Math
The sheer volume of solar coming online is beginning to stress grid infrastructure in ways that operators are only now grappling with seriously. Midday oversupply events — periods where solar generation exceeds real-time demand — are increasingly common in markets like California’s CAISO, forcing curtailment of otherwise usable clean electricity. The buildout of transmission capacity and demand flexibility has not kept pace with generation additions, and that mismatch is one of the central policy challenges the industry faces heading into the back half of the decade.
Storage deployment is the partial answer the market has already started delivering. Co-located battery systems allow solar farms to shift generation into evening peak hours, smoothing the notorious duck curve that grid operators have warned about for years. But the Ars Technica analysis makes clear that storage capacity, while growing fast, still trails solar additions in raw volume. The implication is that grid planners need to accelerate both transmission investment and storage procurement to absorb what the solar industry is now capable of building. At current commissioning rates, the US grid is being remade in real time — and the data from this year’s plant registry suggests there is no slowdown in sight.